Extrapolation
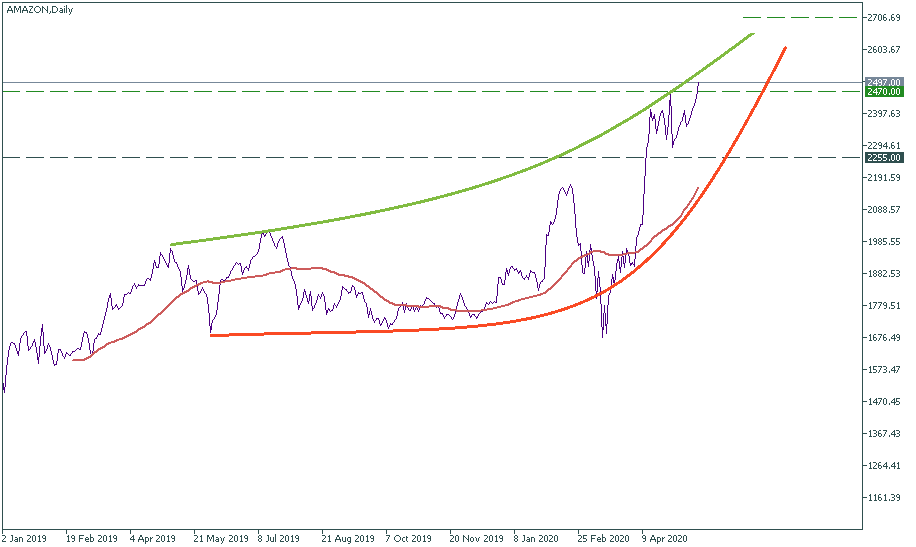
The daily chart shows that Amazon’s stock price – if it was to follow one large movement trajectory - will come to the heights of $2,700 in a matter of weeks, if not days. Indeed, protracting the upward-looking movement channel into the future, we will have a new all-time high quite soon, with the green and red line marking the borders of the fluctuation area. Hence, strategically, the graphic representation of the price movement offers a promising outlook.
Fundamentals
Does Amazon have fuel for that? Situational awareness suggests that it has the full potential for aggressive gains until the world finally gets out of the restrictive social measures. But even then, the after-virus era will likely be much more reliant on remote activities and deliveries, so a softer, but still an aggressive growth is expected for the business of Amazon in the future. Of course, under the conditions that big swan happens: neither a global one nor specifically for Amazon.
Geometrics
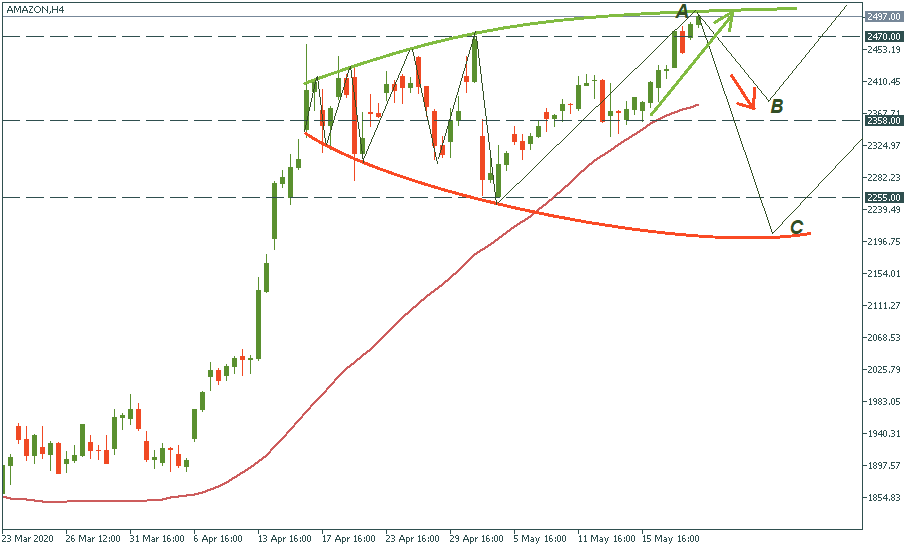
On the H4 chart we see the recent history of how Amazon stock performed. The local event that changed the disposition a bit was the April rise mainly due to reported rise in all sides of Amazon’s activities, which was confirmed by the financial report of the Q1 on April 30. That formed a new tactical base for this stock’s performance: it is presented by the level of $2,358 which lays in the middle of the movement channel. We can assume it will stay the center of gravity for this stock’s performance until any big event tilts the balance, especially if it happens not in favor of Amazon. Alternatively, we may assume that this channel will remain valid until the next report comes in – and that will be at the end of July when Q2-2020 will be reported.
Currently, the price is at the upper border of the channel – that is taking place after it broke the previous local resistance of $2,470. From here, we may expect several scenarios.
Scenario 1
The price goes straight upwards and pushes higher the boundaries of the movement area just like it did several times previously in both directions. That means, in Point A, where we are now, there will be a bullish breakthrough.
Scenario 2
Point A will see the price bounce downwards. Consequently, it will drop to the “heart of the channel” at $2,358 to bounce back up again.
Scenario 3
Point A will see the price go down, but this leg will be the extension of the channel width downwards – to Point C. Consequently, the price will rise again.
All these scenarios eventually fall into the bigger bullish framework exactly because up to our knowledge, the fundamentals and the virus situation favor Amazon business’s growth. That why it is a worthy asset as of now. As usual, we will time-check these assumptions and verify them against the actual price performance in the coming days. Stay with us to discover what happens and what to get from it.
TRADE IT