

Saham: Laporan pendapatan Q1'2021 akan diumum!
Saham apakah yang akan paling awal sekali menerbitkan laporan suku tahunannya? Jom kita tinjau dan bersiap sedia untuk saksikan gerakan di pasaran saham!
2021-01-14 • Dikemaskini
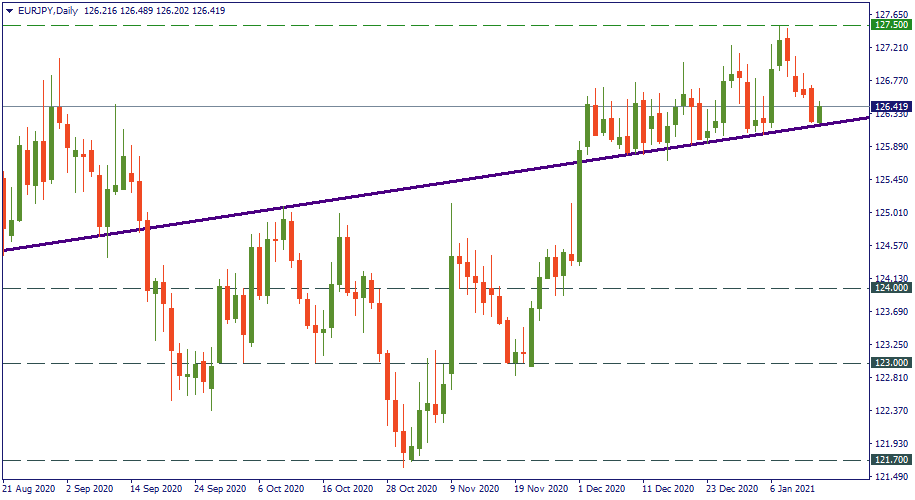
First, the trend line. How to draw trend lines is one of the most frequently asked questions. On the chart below it should be visibly obvious how to do that. See if you can find a sequence of highs or lows that seems to follow the same line – and draw that line. Here, we have such a sequence: all that comes after December 1 is well lined-up in a straight upward trajectory.
There is more: although it didn’t fit into the chart, but the side on the left – that comes before August 21 – also follows the same trend. How to explain that: possibly, assuming that the September-November set back was just a temporary correction of a larger upward trend. In any case, there is no denying that the ascending trajectory on the left and the same on the right follow exactly the same uptrend. That is why we have it over there.
How to use it? Extend the trend into the future. When does it supposedly come to, say, 127.50? In two-three months. Now, that’s your basis for long-term planning. It may be there earlier, or, it may fall behind that trajectory, but at least for position trading you already have a plan: the resistance of 127.50 to be reached in April.
What else do we have here? Several layers of support. 124.00, 123,00, and 121,80. The first two are probably even more valid as these are round levels. So, here is another F. A. Q.: “How to draw support and resistance levels”? Here you go: observe the stairs-like nature of the dropdown and its resolution that happened in September-November. During these months, the price doesn’t seem to have stopped at other levels but these three. This is your guide to find supports: if the price touched the same bottom several times, this is your support level. 123.00 is the most frequently visited line here. It was slightly broken in September, touched in October, and made the price reverse in November.
What use do you make of this one? For future references and preparations. If you see that the long-term picture point to the downside – you’ll know that 123.00 may be one of the key targets for the price. IF and when it comes down there, it will be having the strongest potential to send the price back up as it did already several times.
So, that was your practical briefing on how to set trend lines and support levels. Thank EUR/JPY.

Saham apakah yang akan paling awal sekali menerbitkan laporan suku tahunannya? Jom kita tinjau dan bersiap sedia untuk saksikan gerakan di pasaran saham!

Tahun 2020 akhirnya melabuhkan tirainya. Akhirnya. Mari kita lihat apa yang berlaku di pasaran Forex sepanjang tahun berkenaan dan cuba mencari tahu apa yang mungkin berlaku pada tahun berikutnya.

Baru-baru ini, emas telah mendaki melepasi paras harga $1750 menghampiri aras rintangan bulan Mei, di $1764.

Fed mengumumkan pada hari Rabu bahawa ia membiarkan kadar dasar tidak berubah pada 5…

Jepun melangkah lebih dekat kepada campur tangan mata wang dengan amaran terkuatnya apabila yen merosot ke paras paling lemah dalam kira-kira 34 tahun berbanding dolar…

Sentimen pasaran yang memulih pada pembukaan dagangan awal minggu semalam telah menukar semula haluan pergerakan USD…
FBS menyimpan rekod data anda untuk mengoperasikan laman web ini. Dengan menekan butang "Terima", anda menyetujui Polisi Privasi kami.
Permohonan anda telah diterima
Pengurus akan menghubungi anda dalam amsa terdekat
Permohonan panggil balik seterusnya untuk nombor telefon ini
boleh dilakukan dalam dalam
Jika anda mempunyai isu yang perlu disegerakan, sila hubungi kami menerusi
Live Chat
Masalah dalaman. Sila cuba sebentar lagi
Jangan bazir masa anda – pantau bagaimana NFP mempengaruhi dolar AS dan kaut keuntungan!
|


