Jewel of the world
The fundamental problem with the market analysis is that analysts can come up with any kind of theory explaining why the market moved this way or that way, but as soon as the analysis comes to the moment of prediction, any theory usually breaks down and cautiously stops saying “hey-hey, I just wanted to point out what caused this and that, where it goes now – time will show”. Why? Because there is always a multitude of factors influencing the market and these factors are not even alternate-mode like bearish or bullish. The fact that our chart show as a two-dimensional representation of the market in terms of price level versus time cannot deny the fact that this is only one facet of the jewel, while the true inner nature to the market is multidimensional. That is because it is made by people and is run by people and people’s behavior is multidimensional, and you cannot always conclude it to be either good or bad for something, even if that is how our brain works to facilitate our understanding of the world. And among those factors, which all go in all possible directions in relation to the market, there a lot that can be chosen to justify nay moved that market makes – literally any.
That is, if tomorrow S&P loses 20%, there will be people who will surely explain it by something. If, on the contrary, S&P gains 20%m there will also be people who will justify why that “had” to happen. Very probably, in both scenarios, it will be the same people. In other words, no one really knows where the total multitude of factors pushes the market. No one can take responsibility to claim and bet his or her professional reputation on predicting the inevitability for the market to move in a given direction.
That’s why, whenever we look at the charts, we have to bear in mind that it is fundamentally inconceivable to predict where exactly the market will go. Stating something general like “Eventually, the market will regain all its losses” will be as true as useless as there is no help for traders in such a general observation. Hence, effectively, you choose what to believe, and here are two opposite scenarios for you to have a look at.
Two ways
Needless to say, the week starts badly for the stock market. Warren Buffet sells his airlines shares, Elon Musk recognizes that Tesla shares are overpriced, Donald Trump blames China for the whole mess of the virus, etc. That is, if we take the last several working days as the fresh input for fundamental analysis, it will produce a relatively dull outlook. Even despite the reopening start for Europe and certain good signs here and there, the main message of the day is “the market didn’t price in enough of the virus damage”.
With that heavy-grey tone in the background, let’s have a look at S&P. After it hit the bottom at 2,180, it made one recognizable leap to 2,630: +450 points = + 20%. After, it fell to 2,456 dropping 6%. Then we saw the next upswing from 2,456 to 2,880: +424 point = +15%. Then it dropped to 2,720 losing 5%. Eventually, it proved to be another bottom before a third wave up started: up to 2,965, +245 points, +10%. And currently, the index is at 2,800 giving up 5%. The question is, where will it go?
If we just take those three leaps with each following drop and make a sequence with them, it will give the following picture: +20%, -6%, +15%, -5%, +10%, -5%. Each upswing is weaker and weaker, while each following drop maintains its relative power. If we visualize that and extrapolate this behavior, it will give us the next upswing which will barely reach the last high of 2,965, at the very best.
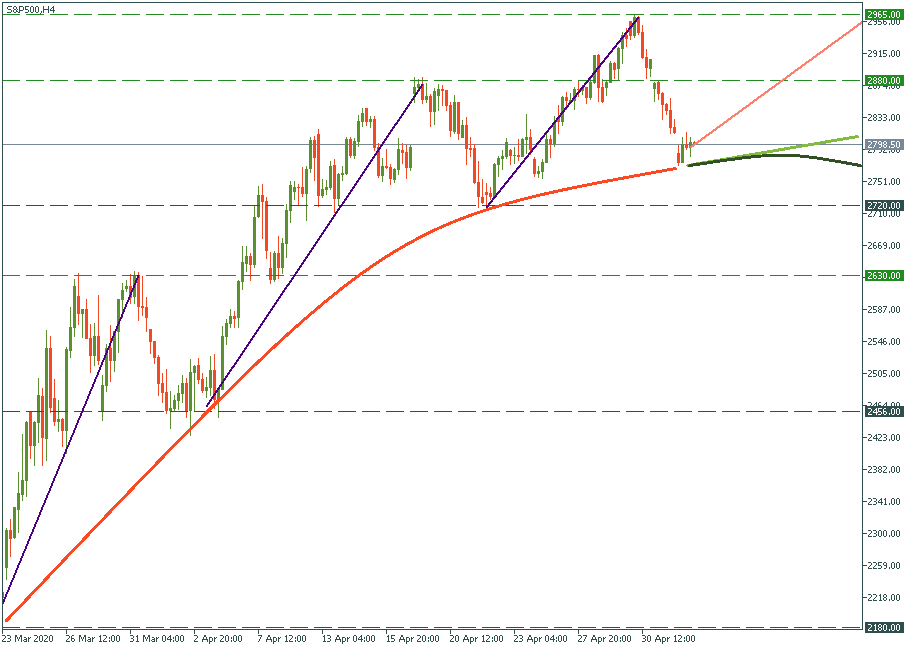
The true risk in this scenario is not whether the last high will be reached or not. The question is whether this diminishing bullish trend gradually loses its moment at all and converts into a huge bearish wave down which will lead to possibly a new bottom. Some analysts predicted a month ago that 2,180 was not the final bottom. May they be right? Anyone can be right – that’s one of the few lessons of the market.
At the same time, that was just one of the scenarios, although quite a heavy one. A more balanced and optimistic one may be well represented by the light green continuation of the salmon-color trend line on the chart. That is, the bulls will keep leading the market, just at a slower pace. Is that realistic? Very possibly. The truth is, as justified as the explained extrapolation looks like, no past history guarantees the next step of the market. No trend guarantees its continuation – here are some examples.
Mind games
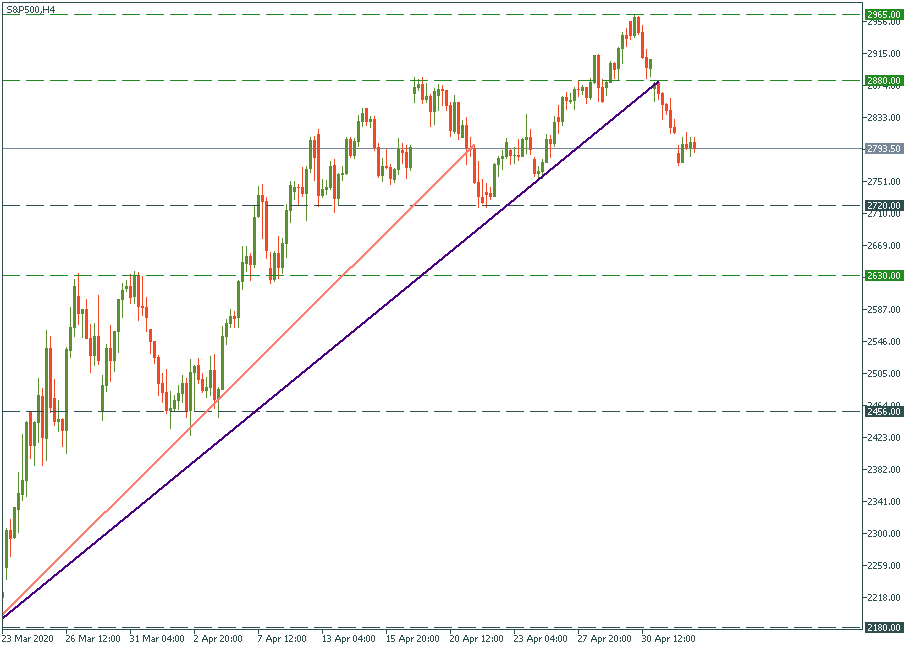
In the course of the second wave up the stock market was in, analysts could have drawn the uptrend (salmon color) expecting that it will continue. But eventually, it was crossed on the way down at 2,793 – the uptrend was broken. At that moment, anyone could have said “it may be a strategic bearish reversal leading to the second bottom below 2,180” – and could have been right. At the same time, such an apocalyptic scenario could have been discarded by some else saying “No, it’s just another local bottom before it goes back up” – and eventually, this proved to be the case. Now, we have another uptrend (indigo color) which was also crossed on the way down at 2,880. What does it mean? We cannot know. It can mean just nothing. Is there a lower tactical low? No. but the trend was broken? Yes, the one we draw. But the market doesn’t care what we draw – the market just goes where it wants. So it is us playing our mind games with ourselves and imagining trend lines where they are not and seeing the price cross them here and there. Fundamentally, the only use and purpose of trying to find a trend line is to have it predict the future move. Drawing lines in hindsight – even a baby can do it. Geometrically, you just need two points to draw a straight line between them. But even if you find ten points which give a straight line on the chart, it doesn’t mean that the market will follow it. What to do then? Prepare for all scenarios, prepare all of them, and keep trading.
LOG IN