Limitation
The stock market behaves pretty strangely. That’s normal for a human being when any kind of crisis happens, but for us, traders, this general acknowledgment is not enough to build our strategy upon. We intend to look into the future – to lift the shroud of mystery. With the limitations of cognition, corruption of information, and an ever-changing environment producing new data inputs, there is little more than what humans normally do to predict the future – look into the past. Such an approach cannot be applied blindly, of course, and sometimes may even mislead an imprudent examiner, but at times gives valuable insight into what the future may hold. Let’s do the same with the S&P which recently made one of the strongest advancements since its epic rise from the ashes in March.
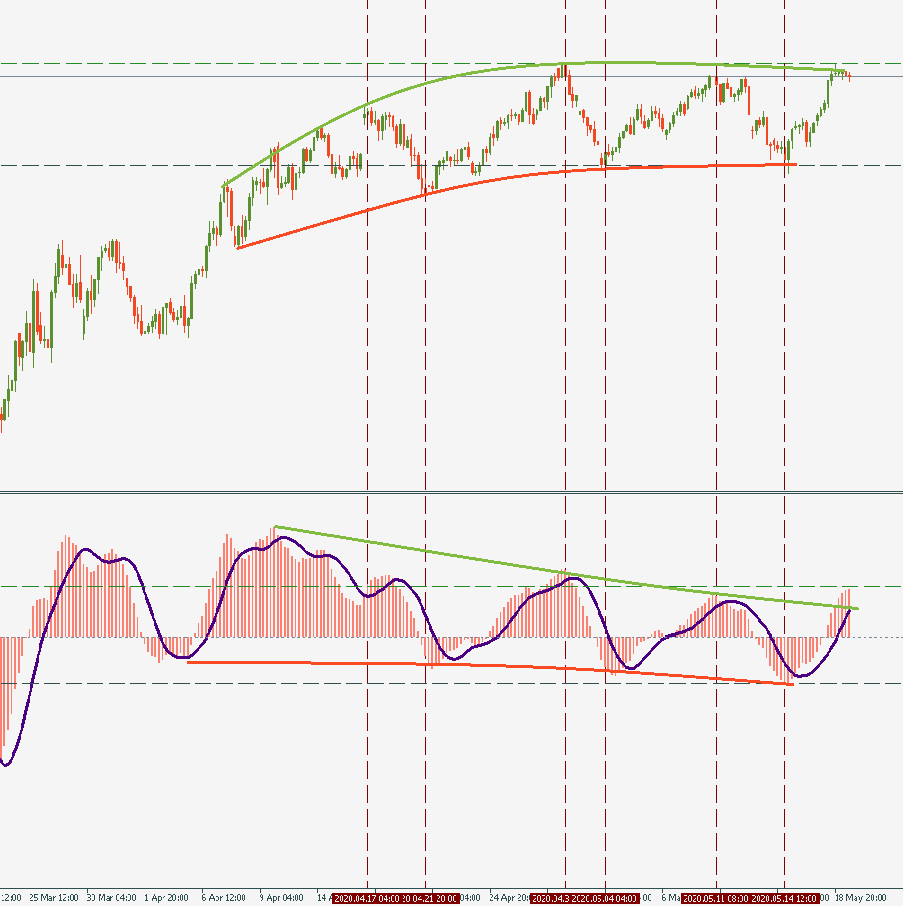
Observation
We are seeing the S&P tip at 2,940. The question is: this is another peak of a sideways cascade between 2,775 and 2,965, or it’s a precursor to a bigger drop? It may be none of that: very possibly, it is just a short stop before a new upward move. The latter, though, seems too optimistic as even the MACD suggests that the current level is at least a local high. Therefore, the most well-balanced question will probably be: will the S&P bounce upward to rise further or it will drop deeper? Maybe, much deeper…
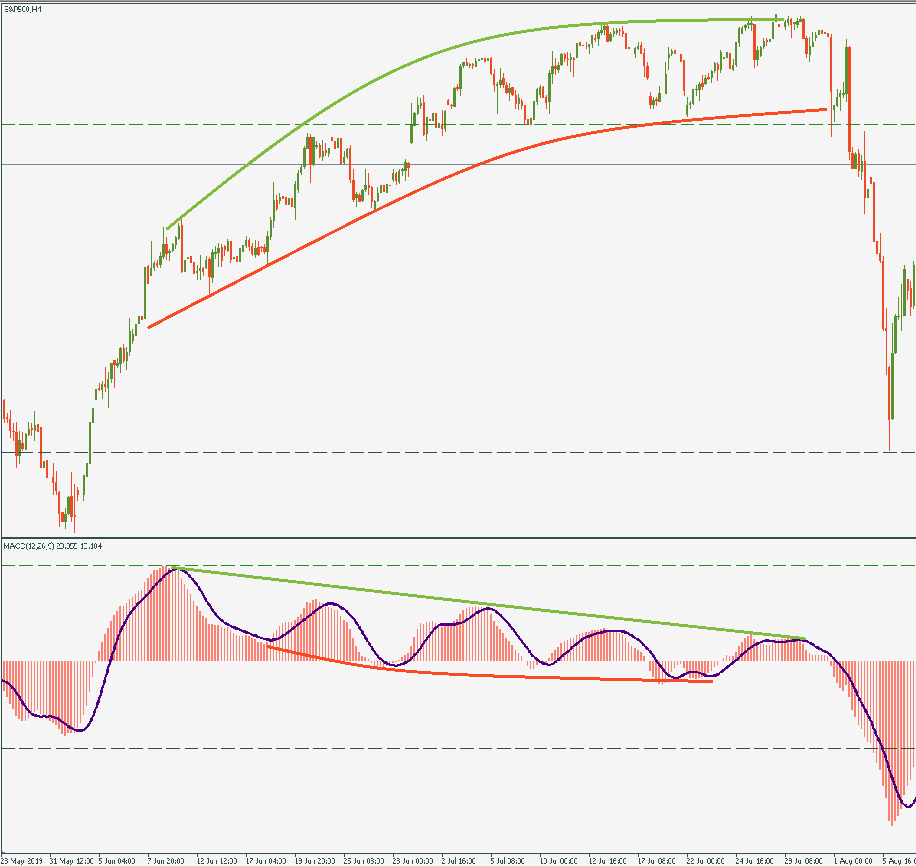
Let’s rewind a year ago and look at the last summer. There was a similar picture of recovery after a drop. S&P started with large leaps upwards and continued the trajectory with a milder curve pulled tighter to the horizon. In the end – it made a big drop erasing almost of its gains. Quite importantly, note that the chart of the S&P was in a similar configuration with the MACD: the former was rising, gradually slowing down the upward velocity, the latter was slowly going down in waves.
Expectation
As we mentioned, the coming drop is very likely. This likelihood – although not a certainty – puts us in a comfortable position to consider whether this drop will be just tactical or strategic. To make this judgment, let time align all the indications, among which the first one will be the behavior of the S&P against the support of 2,775. Let’s watch it and come back together to re-group for new observations and conclusions.