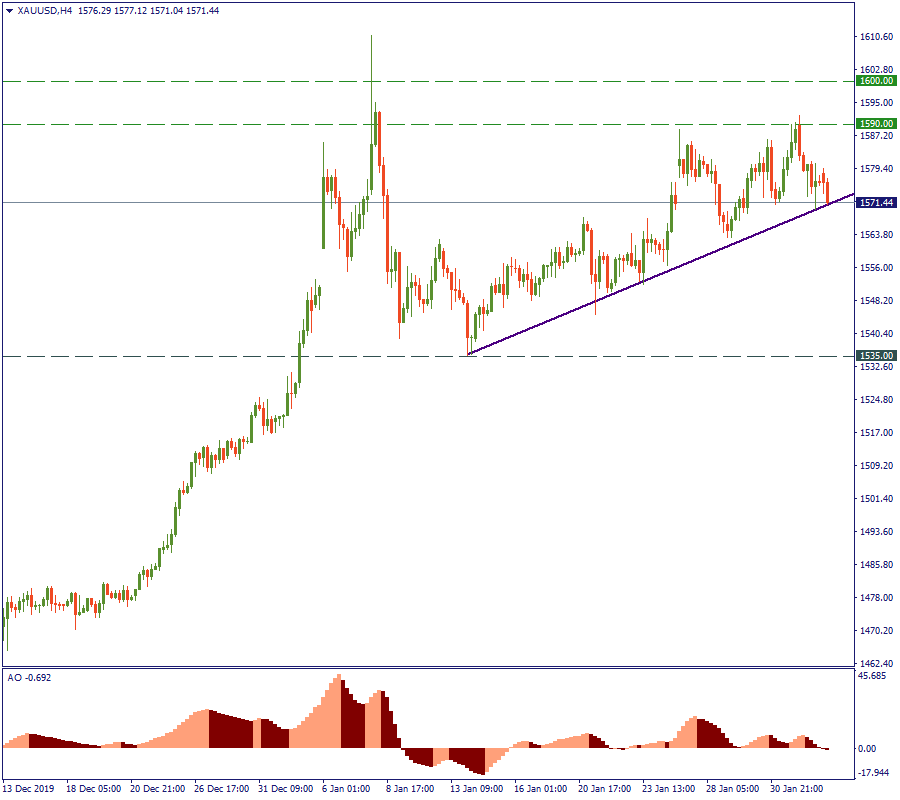
By the weekend
The H4 chart below shows how gold reacted to the virus. Rising from $1,535 to $1,590, it came to the level $10 away from its 6-years high. At the pace the virus is raging, or at least at the pace the efforts to suppress it are exacted, we may well see $1,600 at the end of this week. So from the mid-term perspective, you only need to follow the news reports and estimate how fast the virus is expected to be brought down to the comfortable zone of controllability. Most of the media report authorities advising against resuming normal business activities in China and related countries until next week. Therefore, plan your trades accordingly. The next checkpoint will be this weekend.
Play it long
The almost unnoticeable line at the very end of the weekly chart of XAU/USD is the uptrend marked above. As you can see, there is little the Coronavirus changed on the grand scheme – at least, for now; at least, for gold. Even if nothing happened and the observers did not speak about hedging strategies, black swans and the Chinese failure to recuperate after the trade war because of this, still you would expect the price to keep rising. Also, you would not need the recent US-Iran week-long conflict escalation in the Middle East to expect the price to come to $1,600 eventually. At least, after gold broke the 6-years-resistance of $1,375, which was keeping it in the sideways movement since 2013. There is an interesting technical element, however: a regular bearish divergence, predicting a coming mid-term decline. That may be useful for you if you prefer to sell gold now and come back a month later to buy it at a lower price.
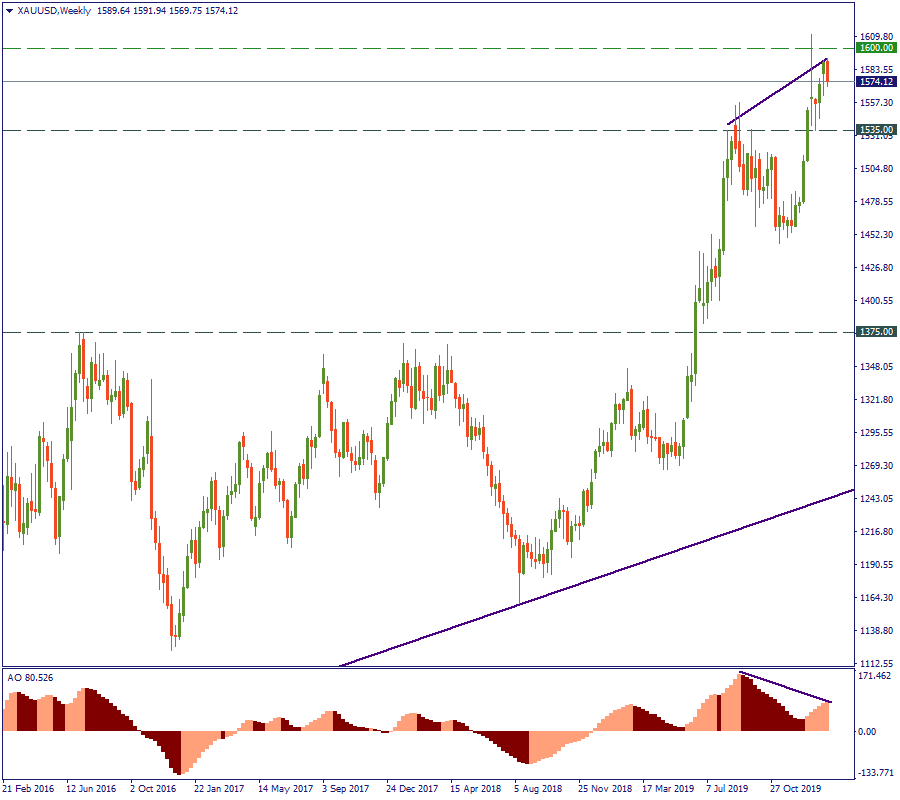
But if we rewind the tape before summer 2019 – meaning, if we place ourselves back into that period of the sideways movement with the imposing resistance of $1,375 – what would be our impression? Or what should it be?
The answer to this is: always look at the further horizon. So let’s see it.
The last horizon
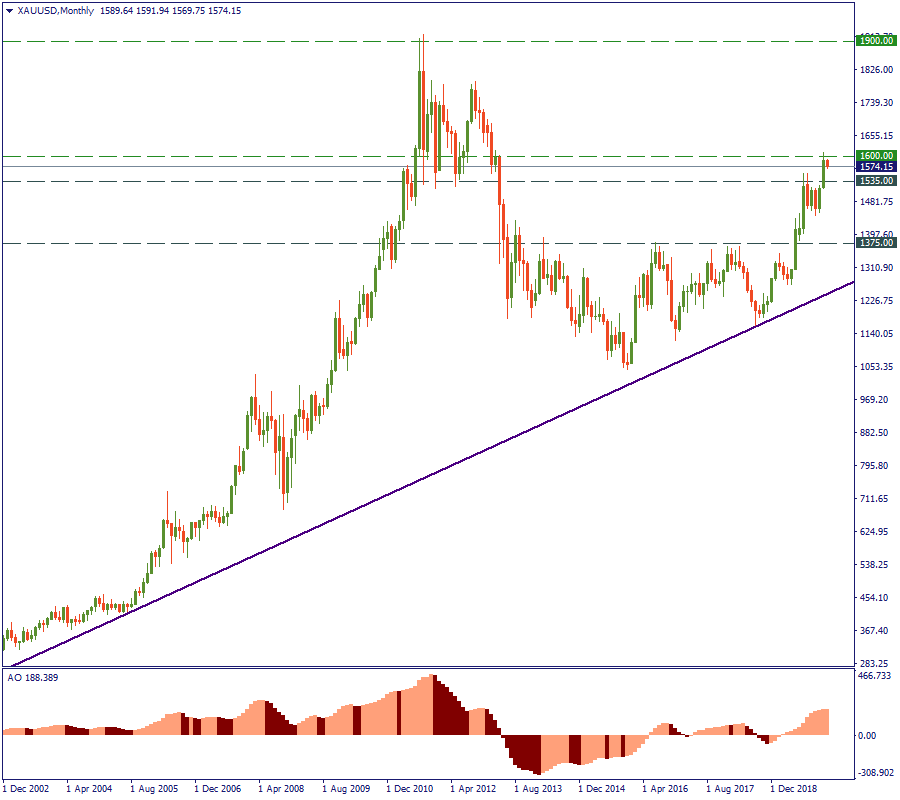
The maximum observable depth for gold in MetaTrader is back to 1997. The monthly chart below crops the initial 5 years and starts with 2002, but it doesn’t change the picture much. The essence is, even removing the scary years of the global financial crisis 2008-2011, the trend seems to be unstoppably upward. Using the method of simple extrapolation (like any prediction-based scientific model would do), it is most likely to see another twenty years of rising price for gold. As fantastic as it seems right now, the cosmic all-time high of $1,900 appears pretty reachable from this perspective. If the pace and trend stay the same, we may well see that within 5 years.
Conclusion
Trade gold. It’s worth it. At least, you will diversify. At most – you will be rich by 2025.
LOG IN