
Saham: Laporan pendapatan Q1'2021 akan diumum!
Saham apakah yang akan paling awal sekali menerbitkan laporan suku tahunannya? Jom kita tinjau dan bersiap sedia untuk saksikan gerakan di pasaran saham!
2022-12-20 • Dikemaskini
We discussed previously some of the trend reversal chart formations. Hammer is one of them. Speaking about its composition, it has two parts: a head and a grip. These are essential to interpret it correctly. Normally, it a hammer's head is lower as if it was falling - that's a bearish reversal coming. If the head is above and the grip is below - bulls are taking over. Let's check through some particular examples.

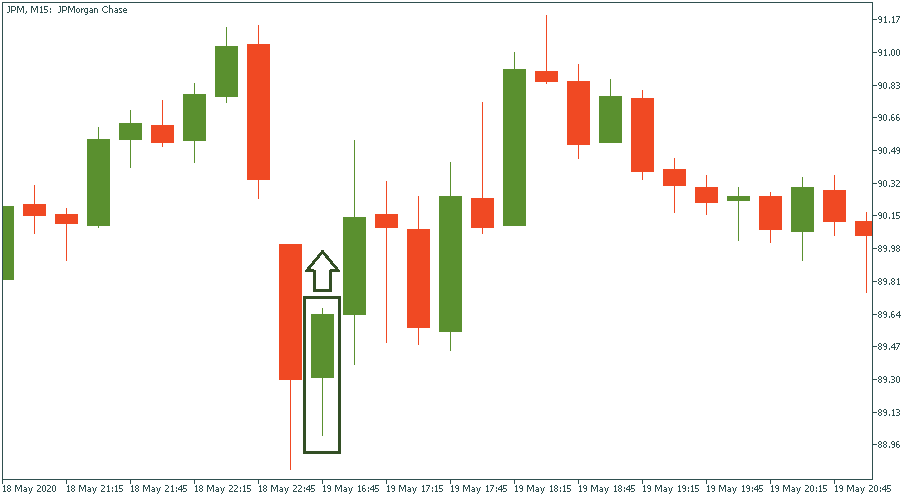
An ideal scenario is a clear green/bullish hammer with a head pointing upwards. That’s a classic example of a hammer formation predicting an upward reversal. In the M15 chart of JPMorgan stock price, this reversal is quick to come – and quick to leave.
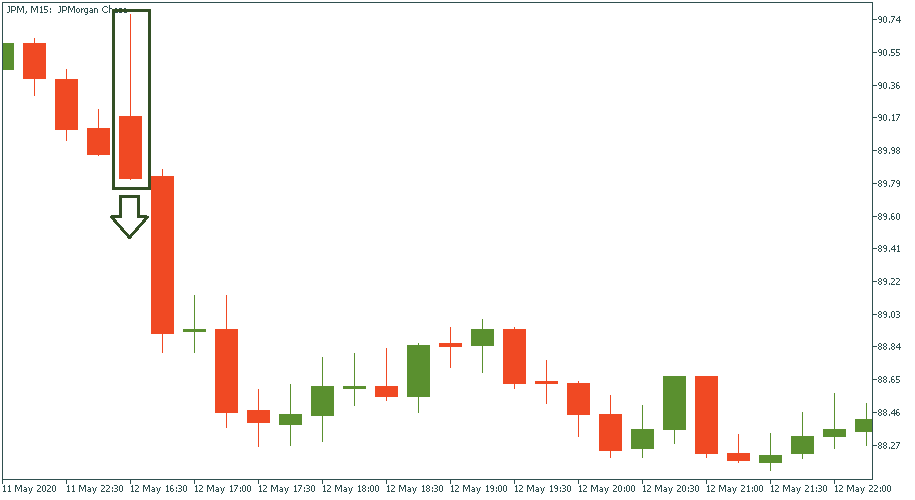
For a downtrend, we have the same logic. A clear red/bearish hammer with a head pointing down – that’s a sign of a downtrend. In this particular chart, it comes immediately after the hammer but stops a few candlesticks later.
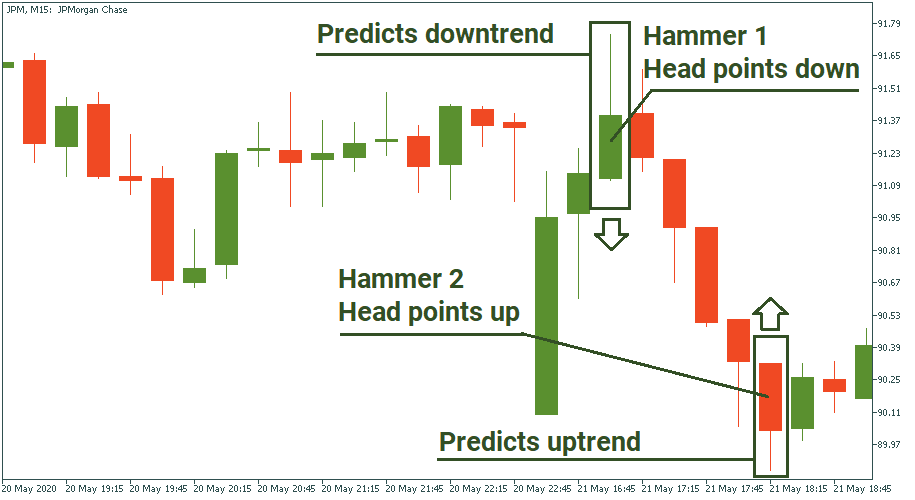
There are cases when the color of the hammer candlestick contradicts its direction. In this case, we disregard its color and take its direction as a basis for interpretation.
In the JPMorgan chart below, we see hammer 1 formed as a green/bullish candle. Nevertheless, its head points downwards. Hence, leaving the color aside, this candle should be taken as a bearish sign – and so it eventually fulfills. The second hammer formation comes here as a red/bearish candle. But as long as its head points upwards, it is a bullish sign – and so it happens straight after.
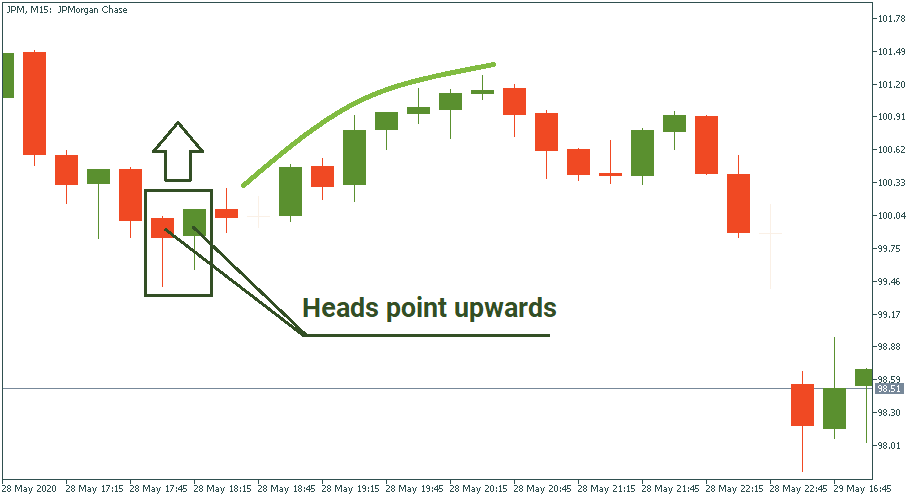
Sometimes, hammer candles come one after another. That’s a stronger confirmation of the observed direction if both agree where they point at. In the below example, a red/bearish and a green/bullish hammer stand one next to another, and both have their heads point upwards: that means both confirm the upside potential. Immediately after, it takes place, although for not too long.
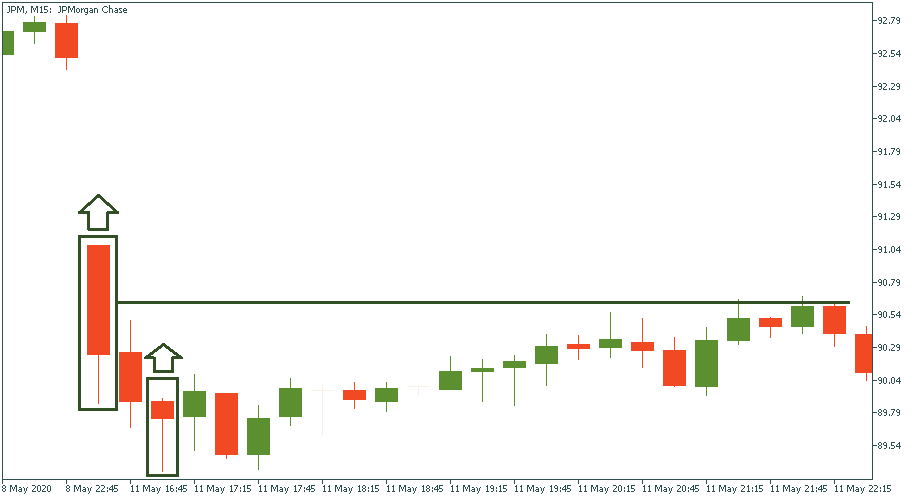
You will encounter a lot of cases when the trend change predicted by hammer formation is not only short-lived but also weak or even insignificant. On the M15 chart of JPMorgan below, we see two hammers pointing upwards. In theory, that should come as a strong sign of a bullish reversal. Eventually, there is indeed a reversal but it is so weak that the highest point of this upward correction hardly reaches the middle of the first hammer’s head.
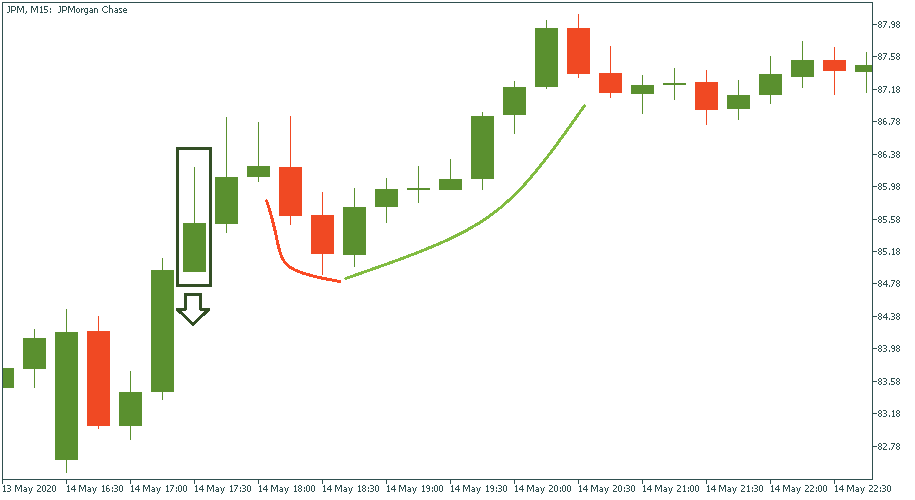
You will also come across hammer formations that result to have no predictive power. In the chart below, the observed hammer is supposed to bring a bearish reversal, but after just two bearish candles not even crossing the low of the hammer, the trend goes upwards.
Hammer formation is ease to notice and use. However, it does have its limitations in terms of its predictive probability. It may be said that it works more often than it doesn’t, that’s why it is a good instrument in trader’s toolkit.

Saham apakah yang akan paling awal sekali menerbitkan laporan suku tahunannya? Jom kita tinjau dan bersiap sedia untuk saksikan gerakan di pasaran saham!

Baru-baru ini, emas telah mendaki melepasi paras harga $1750 menghampiri aras rintangan bulan Mei, di $1764.

Fed mengumumkan pada hari Rabu bahawa ia membiarkan kadar dasar tidak berubah pada 5…
Jepun melangkah lebih dekat kepada campur tangan mata wang dengan amaran terkuatnya apabila yen merosot ke paras paling lemah dalam kira-kira 34 tahun berbanding dolar…

Sentimen pasaran yang memulih pada pembukaan dagangan awal minggu semalam telah menukar semula haluan pergerakan USD…
FBS menyimpan rekod data anda untuk mengoperasikan laman web ini. Dengan menekan butang "Terima", anda menyetujui Polisi Privasi kami.
Permohonan anda telah diterima
Pengurus akan menghubungi anda dalam amsa terdekat
Permohonan panggil balik seterusnya untuk nombor telefon ini
boleh dilakukan dalam dalam
Jika anda mempunyai isu yang perlu disegerakan, sila hubungi kami menerusi
Live Chat
Masalah dalaman. Sila cuba sebentar lagi
Jangan bazir masa anda – pantau bagaimana NFP mempengaruhi dolar AS dan kaut keuntungan!
|


